LLM temperature: one number that reshapes the next-token distribution
Last updated: April 23, 2026
The interactive below shows temperature at work. Drag the slider between 0.1 and 2.0, click the preset buttons to see smooth transitions, and try all three prompts. The key thing to watch: the left chart never moves when you change temperature. Only the right chart morphs.
Demo
Temperature scaling: logits vs probabilities
Drag a temperature slider and watch an LLM's next-token probability distribution morph in real time. Logits stay fixed on the left chart. Probabilities deform on the right.
What you're seeing
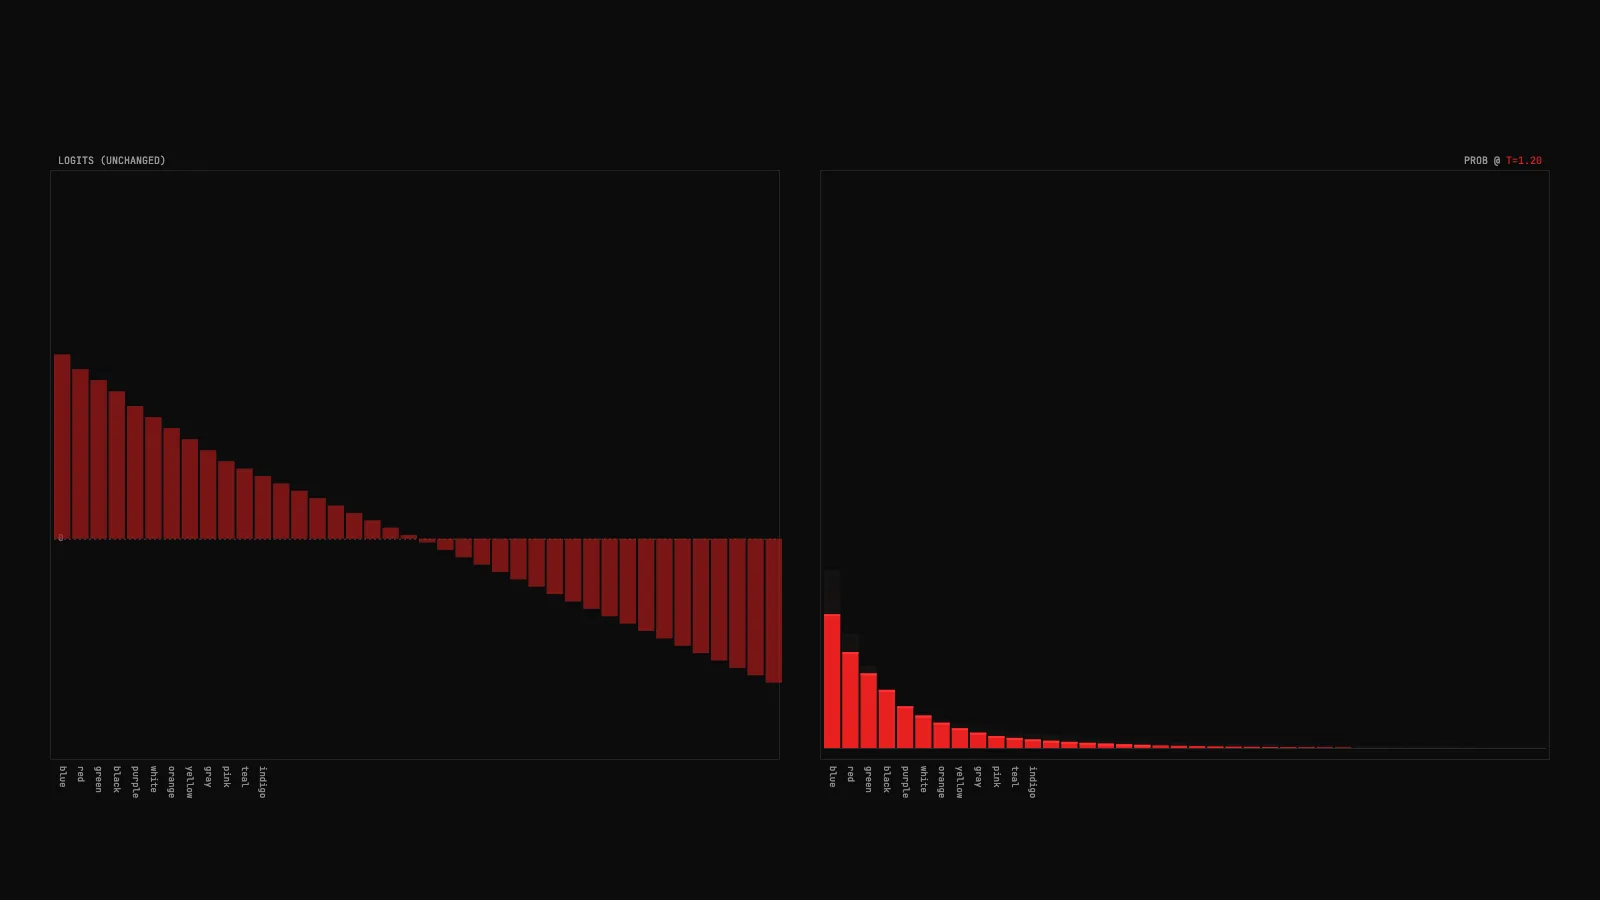
Two side-by-side bar charts, 40 each. The left chart is the raw coming out of the model's final layer. Bars rise above a zero line when the logit is positive and dip below when it is negative. These values are the model's opinion before any normalization.
The right chart is the of those logits, divided by the current value. Bars always start from the baseline since probabilities are non-negative. They sum to 1 across the whole chart. As you drag the slider, this chart deforms in real time while the left chart stays still. The ghost trails you see on the right are the shape of the distribution a moment ago, fading as the morphing settles.
Four live stats in the top-right corner: T (current temperature), ENTROPY (bits of uncertainty in the distribution), TOP_P (probability of the highest-ranked token, how confident the model is), and EFF_K (2 to the power of entropy, the number of tokens that are meaningfully in play). Watch all four move together as you drag.
A few things to try in the demo:
- Pick the math prompt ("Two plus two equals") and drag T to 2.0. The bar for "four" shrinks a little but still dominates. Temperature cannot erase a confident answer.
- Pick the color prompt ("My favorite color is") and drag T through the whole range. The distribution redistributes dramatically. This is where temperature matters most: when the model is genuinely uncertain.
- Pick the weather prompt and click CHAOS (T=2.0). Everything flattens into near-uniform noise. When the distribution is already flat, high temperature destroys it.
- Toggle LIN to LOG on the y-axis at T=0.1. On linear scale the top bar dominates and the tail looks flat. Log scale reveals the actual structure in the tail, where the interesting stuff happens at low temperature.
How it actually works
A language model's final layer produces a vector of logits, one per token in the vocabulary. To turn these raw scores into probabilities the model applies softmax: exponentiate every logit, then divide each by the sum. Temperature modifies this one step by dividing every logit by T before the exponential. That is the entire math.
Why does dividing by T change the shape? Because exp amplifies differences. Dividing the logits by a small T (say 0.2) before exp magnifies the gap between the largest logit and the rest, so one token ends up with most of the mass. Dividing by a large T (say 2.0) compresses the gap, so all the exponentials come out closer to each other and the mass spreads. T=1 is the neutral case.
At T=0 the math breaks (division by zero). In practice every framework clamps the minimum to a tiny positive number, which is equivalent to : always pick the argmax. At the other extreme, T approaching infinity makes every probability equal, which is sampling uniformly at random from the full vocabulary.
Temperature is applied before and in the pipeline, not after. This order matters. Top-p at T=0.5 sees a much sharper distribution than top-p at T=2.0, so the same P value produces very different eligible sets depending on what temperature did first.
One subtle point the demo makes visible: temperature never changes the ranking of tokens. The most probable token at T=0.1 is the same as at T=2.0. Only the gaps between them change. A tied logit stays tied at every temperature, and a nearly-tied pair stays nearly-tied. This is why temperature is a blunt instrument: it cannot invent confidence the model does not have.
Picking a temperature
The right value depends on the task, not on the model.
- Deterministic or structured output: T=0 (greedy) or very low T (0.1 to 0.3). Code generation, JSON output, structured extraction. Anything where you want the best single guess and no creativity.
- Factual Q&A: T around 0.3 to 0.7. Enough variance for natural phrasing without drifting into made-up answers.
- Conversational defaults: T around 0.7 to 1.0. The typical default you see in chat interfaces.
- Creative writing or brainstorming: T around 1.0 to 1.3. Pair with top-p around 0.92 to 0.95 so the tail does not pull in genuinely broken tokens.
A common antipattern is cranking temperature to 1.5 or 2.0 to make the output feel more interesting, then being surprised when the model starts producing nonsense. The bottom of the distribution is the bottom for a reason. High temperature pulls those tokens into play.
For the full picture on sampling after temperature is applied, see the top-k and top-p demo. For the vocabulary around inference parameters, see the glossary.
Key takeaways
- Temperature happens before top-k and top-p, not after. If you chain them, the order matters, because top-p at T=2.0 sees a much broader distribution than top-p at T=0.5.
- T=0 is a mathematical singularity (division by zero). Production stacks clamp to a tiny positive number which behaves the same as greedy decoding: always pick the argmax.
- Temperature cannot create confidence where there is none. If two logits are nearly equal, no amount of low T makes one clearly win, because the ratio between them is preserved.
- Effective k (2 to the power of entropy) is a better intuition for "how spread out is this distribution" than the top token probability alone.